Find what makes your PHP app slow
You know something is slow, but not what. Buggregator collects XHProf profiling data and shows it as flame graphs, call graphs, and function tables. See exactly where time is spent \u2014 wall time, CPU time, memory \u2014 in every request.
Interactive flame graph with function-level wall time, CPU time, and memory usage
Understand your application's performance
Multiple ways to visualize profiling data. Find the bottleneck that matters.
Flame graphs
Interactive flame graph visualization. Zoom into call stacks, identify hot paths at a glance.
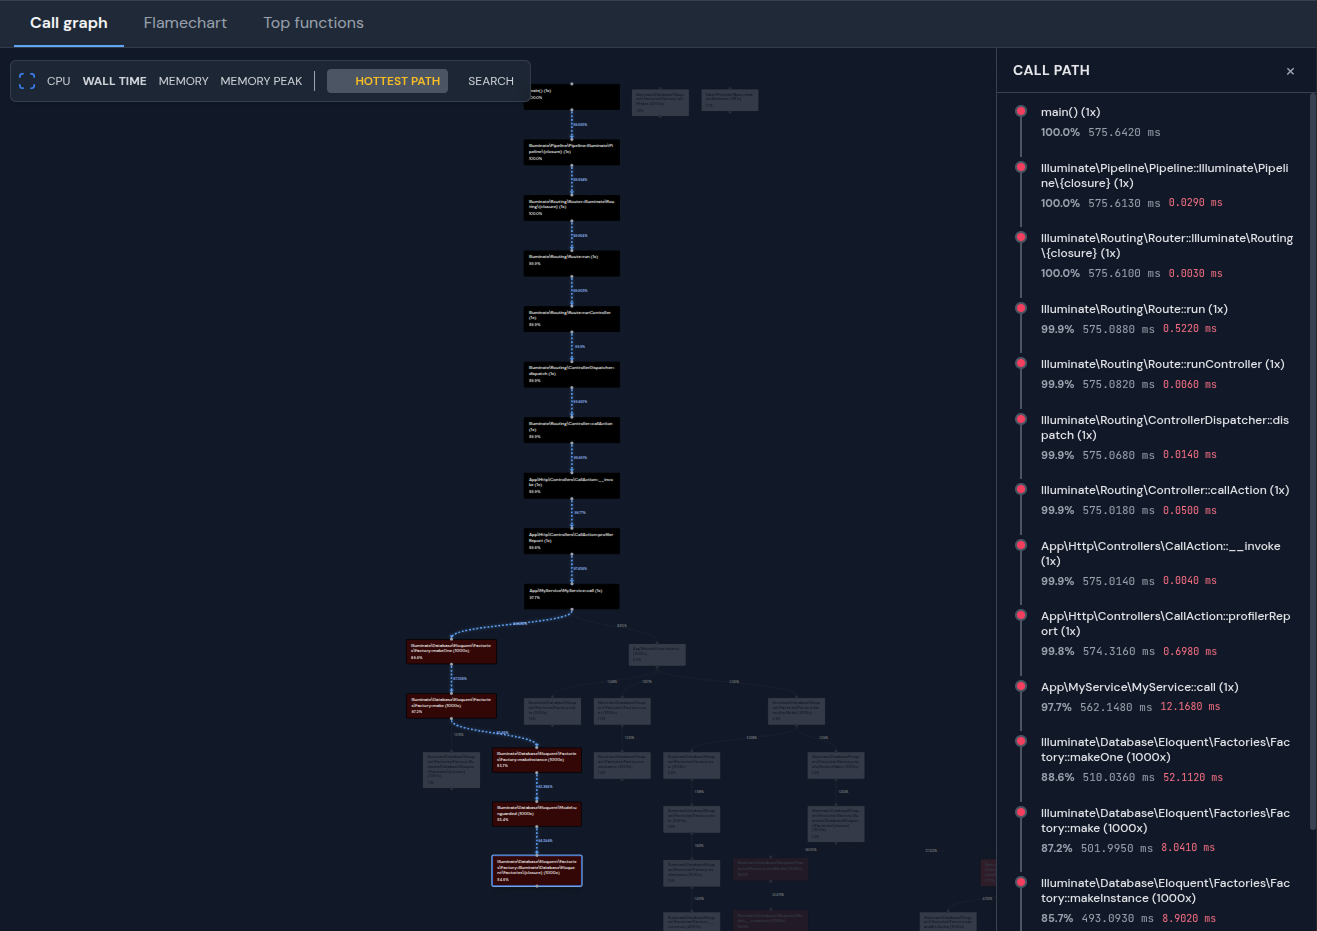
Call graphs
Tree visualization of function calls with color-coded execution time. See which branches are slow.
Top functions
Sortable table of all functions by wall time, CPU time, memory, and call count.
Profile comparison
Compare two profiles side by side to spot regressions. See exactly what got slower and by how much.
Wall time & CPU time
Distinguish between time waiting (I/O, DB) and time computing. Find the real bottleneck.
Memory tracking
See memory allocation per function. Find memory-hungry code before it causes problems.
Setup in 60 seconds
No registration. No config files. Just run and connect.
Start Buggregator
The profiler endpoint runs on the same port 8000 as everything else.
$ docker run -p 127.0.0.1:8000:8000 ghcr.io/buggregator/server:v2.3.1
Install the XHProf extension and profiler package
Install the XHProf PHP extension, then add the profiler package for your framework.
# Install XHProf extension
$ pecl install xhprof

# Install the Laravel profiler package
$ composer require --dev maantje/xhprof-buggregator-laravel

# .env
PROFILER_ENDPOINT=http://profiler@127.0.0.1:8000
Load a page — see the profile
Make a request to your application. The profile data is automatically sent to Buggregator where you can explore it as a flame graph, call graph, or sorted function table.
Works with PHP frameworks
XHProf is a PHP extension. Buggregator provides profiler packages for popular frameworks.
Ready to try it?
One command to start. No account needed.
Also built into Buggregator