See your exceptions locally, with full context
When something breaks in development, you want to see the full picture \u2014 stack trace, breadcrumbs, request data. Buggregator gives you a Sentry-compatible endpoint that runs on your machine. Same SDK, same data, no deployment.
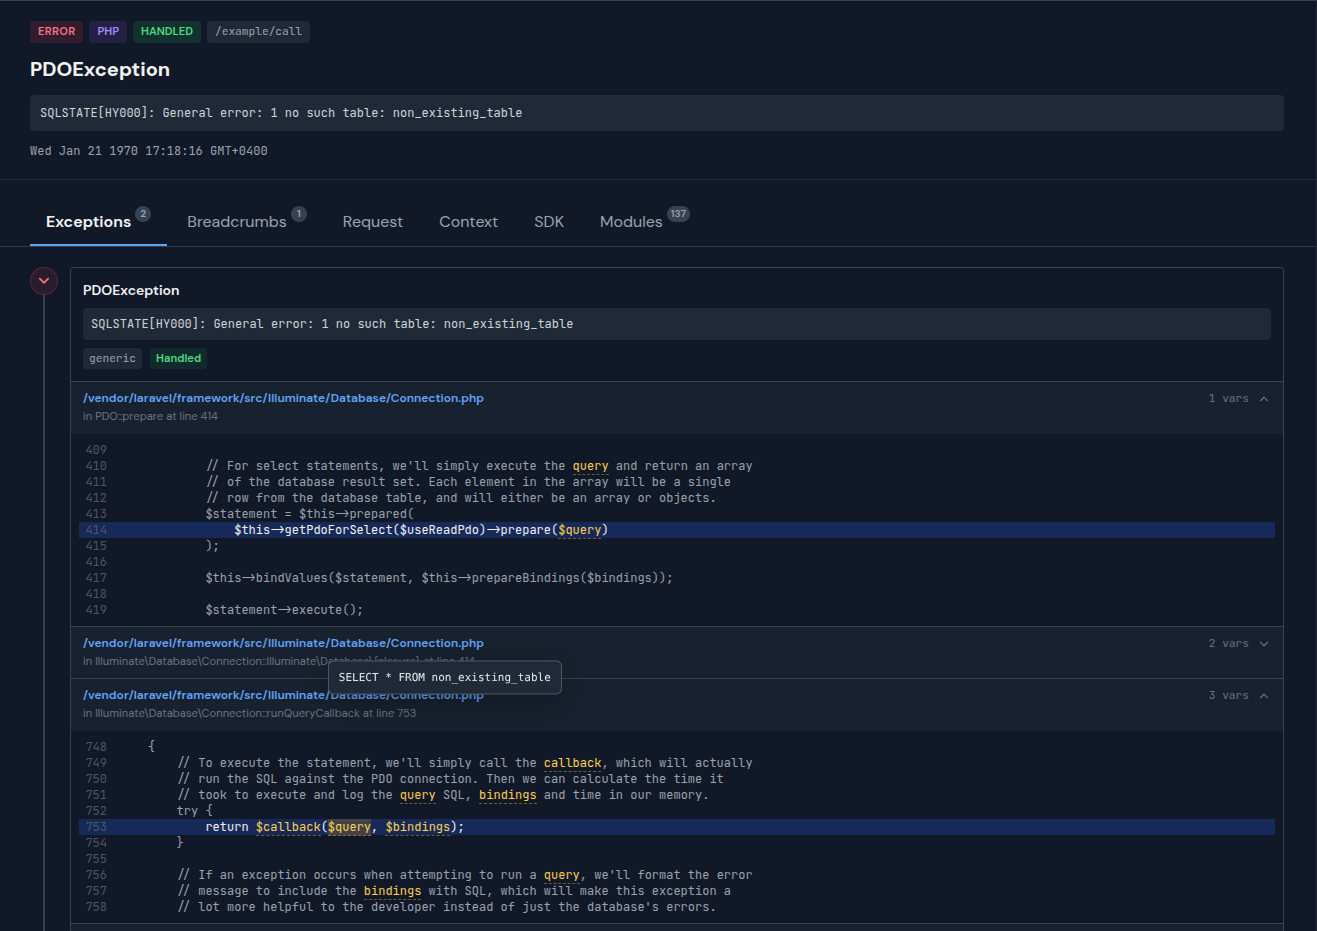
Full exception details with stack trace, breadcrumbs, tags, and request data
Everything Sentry shows you, running locally
All the context you need to understand what went wrong and why.
Full stack traces
Every frame with file path, line number, and code context. Click to open in your IDE.
Breadcrumbs
See the sequence of events leading up to the exception. Queries, logs, HTTP calls.
Tags & context
Environment, release, user info, custom tags — all displayed just like in Sentry.
Request data
Headers, cookies, query params, POST body — the full HTTP request that triggered the error.
Data stays local
Nothing leaves your machine. No API keys, no cloud accounts, no data sharing.
Zero code changes
Same Sentry SDK, same API. Just change the DSN. Switch back to Sentry anytime.
Setup in 60 seconds
No registration. No config files. Just run and connect.
Start Buggregator
The Sentry-compatible endpoint runs on port 8000 alongside the web UI.
$ docker run -p 127.0.0.1:8000:8000 ghcr.io/buggregator/server:v2.3.1
Set the Sentry DSN
Point your existing Sentry SDK to Buggregator. One environment variable, no code changes.
# .env
SENTRY_LARAVEL_DSN=http://sentry@127.0.0.1:8000/1
Trigger an exception — see it with full context
Throw an exception in your app. Buggregator shows the stack trace, breadcrumbs, tags, user context, and request data — just like Sentry would.
Works with every Sentry SDK
Buggregator implements the Sentry ingestion API. Any official or community Sentry SDK works out of the box.
Ready to try it?
One command to start. No account needed.
Also built into Buggregator